
Date / Time: April 8, 12:00PM MDT
Discussion time period: Sunday, April 1 – Saturday, April 14
Week in review:
This past week, the Lost River Range experienced temperatures at the 10,000 foot level that were conducive to moderate melt/freeze cycle. 7 of the last eight days saw temperatures at these elevations above freezing, with night time temperatures well below freezing. Some spring storms moved thru the area that produced little if any snow accumulation at the Hilts Creek station, (8,000 feet). Today, (Sunday) is producing light snow above 8,000 feet.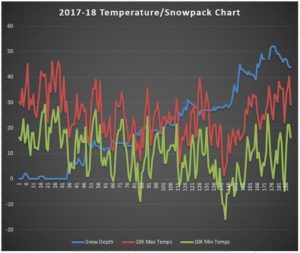
Observations:
A group was climbing and skiing on Mt McCaleb around the 1st of April. Here is the quote from their observations:
Eric Larsen “A quick update on conditions. Snow coverage was good, but the snow was crusty and unsupported. An ascent without skis would be a post hole epic. We also used ski crampons for most of the ascent. Hopefully a few more freeze-thaw cycles will settle it out a bit.”
Forecast:
The NOAA forecast calls for an unsettled week, with highs in the 40’s early in the week and dropping to the 30’s. The next 3 days will see partly cloudy skis and temps above freezing at the 10,000 foot level. Night time temps are forecast to be well below freezing. Given the temperatures, and the moisture, it appears that this next week will be conducive to a moderate melt/freeze cycle occurring in the 8-10K range. I’m sticking with a cautious approach, primarily because we haven’t seen a good melt/freeze cycle above 10,000 feet.
Date / Time: April 1, 12:00PM MDT
Discussion time period: October 1, 2017 – Current
As April approaches, I begin to dream of spring ski descents in the Lost River Range.

Skinning in the basin below Church and Donaldson.
As I take that next step from simply dreaming, to beginning to plan routes and look at possible dates, I have been working on a concept that will assist in the planning process. As anyone knows who follows the action in the Lost Rivers, there is no formal avalanche forecasting or any formal reporting during the winter months. What we do have are 3 key contributors to information on the range:
1) Word of mouth and first hand accounts. (I haven’t seen many of those yet this year).
2) The web cams that allow us to get a rough idea of snow amounts and snow levels.
http://www.lostrivercamera.com/camera_one.jpg
http://birice.vaisala.com/photos/02DA39EF_05C41D33_cam1.jpg
3) The Hilts Creek Snotel northeast of Mackay at an elevation of 8,000 feet. (Latitude: 44 deg; 1 min N, Longitude: 113 deg; 28 min W)
Hilts Creek Snowtel
This article is focused on the 3rd point, the information gleaned from that snotel site. Based on the historical data that I have observed and studied, I have concluded that although this snowpack/weather station is not in the primary climbing / skiing area in the range, it is statistically relevant to an analysis of the snowpack and temperatures. My intention is to closely monitor the snow level data and the Min/Max daily temperatures to assist in determining the optimum times for spring ski descents. The “rule of thumb” that I like to operate with is to look for those melt/freeze cycles to hit, and then to catch it just as the sun is making “corn”!
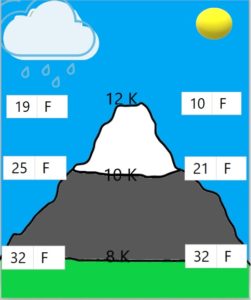
Simplified Temperature Prediction Model
I will be deploying a simplified temperature prediction model that takes the NOAA point forecast each week at the 8,000 ft level near Sawmill Gulch and predicts the temperature at the 10K and 12K elevations in the range. This will be used to get a rough estimate as to probability that a melt/freeze, or “corn” cycle is approaching. The model is adjusted for cloudy days vs. clear days and nights. Of course there are several other factors that would impact any given slope – including angle, aspect and the presence of inversions. The basic formula that is being used is that in cloudy conditions the temperature drops 3.3F with every 1,000 feet of elevation gain and in clear conditions the temperature drops 5.4F with every 1,000 feet of elevation gain.
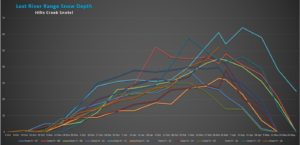
Historical Snowpack Analysis
The historical analysis is really just a brief slice of time, when taken within the context of weather history. I am not trying to infer any long-range patterns, or trends in the data. The purpose here and the observations are limited to an analysis of patterns within the context of recent history. Things like climate change are not even a part of the equation. To that end, I think the following observations are relevant:
As one would expect, the variability from year-to-year for snow accumulation has been fairly significant during this 12 year period. The average is 48 inches, with a minimum of 32 inches and a maximum of 65 inches. There has also been some significant variance on the date when the maximum snow depth is reached, but the melt cycle seems to be tighter. In general, it starts to decrease dramatically in early April and by mid-May, the snow levels at 8,000 feet are non-existent in most years.
| Snow Year | ||||||||||||||||
| 2007 | 2008 | 2009 | 2010 | 2011 | 2012 | 2013 | 2014 | 2015 | 2016 | 2017 | 2018 | Avg | Max | Min | ||
| Max Snow Depth | 41 | 52 | 48 | 65 | 47 | 43 | 38 | 32 | 50 | 61 | 52 | 48.1 | 65 | 32 | ||
| Max Snow Date | 28-Feb | 2-Feb | 2-Apr | no data | 13-Apr | 19-Mar | 6-Mar | 1-Apr | 10-Feb | 17-Mar | 27-Feb | 25-Mar | 11-Mar | 13-Apr | 2-Feb | |
| Snow Melted Date | 6-May | 22-May | 21-May | 15-Jun | 10-May | 12-May | 9-May | 3-May | 7-May | 29-May | n/a | 16-May | 15-Jun | 3-May | ||
2017-18 Temperature Observations
 As can be seen from the data, above 10,000 feet in the range there has not been any significant melt / freeze cycles to-date, (ignoring October and early November before there was any real snow depth this year). Certainly the solar heating on east, south and west aspects has created layers of sun crusts but it is doubtful that the northern aspects have experienced any of this. There have been some significant cold, dry spells that could have contributed to persistent weak layers in the snowpack.
Bottom-line at this point is that we actually need some really warm days and cool nights, even at those elevations to begin to firm up the snowpack and get the corn cycle going.
2017-18 Snowpack Observations
The snowpack in the Lost Rivers has quietly and steadily worked its way up to a tie for the 3rd highest in the 12 years of data that I have gathered. This is good news for those of us looking to get some good lines in the range! As I pointed out in the temperature discussion, there will be the potential for PWLs in the snowpack. 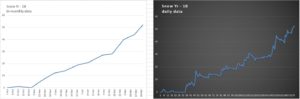
An analysis of the data would indicate that the two problem time periods would be December and February. The December period will be in the bottom 25-30% of the snowpack and the February period will be at approximately the 60% level.
Forecasted Melt/Freeze Cycles
March 31 – April 6
<name>Daily Maximum Temperature</name> <value>43</value> <value>40</value> <value>44</value> <value>37</value> <value>39</value> <value>45</value> <value>46</value>
<name>Daily Minimum Temperature</name> <value>26</value> <value>25</value> <value>24</value> <value>15</value> <value>24</value> <value>23</value>
Based on this data, (from 8,000 feet point cast Sawmill Gulch), the first week of April does not seem likely for any real melt/freeze days above 10K.